
AI Mechanism Diagram Generator: Build Clear Pathway Figures
Create mechanism diagrams with AI using a node list, explicit connections, compartment boundaries, and a review workflow. Includes a prompt and arrow conventions.
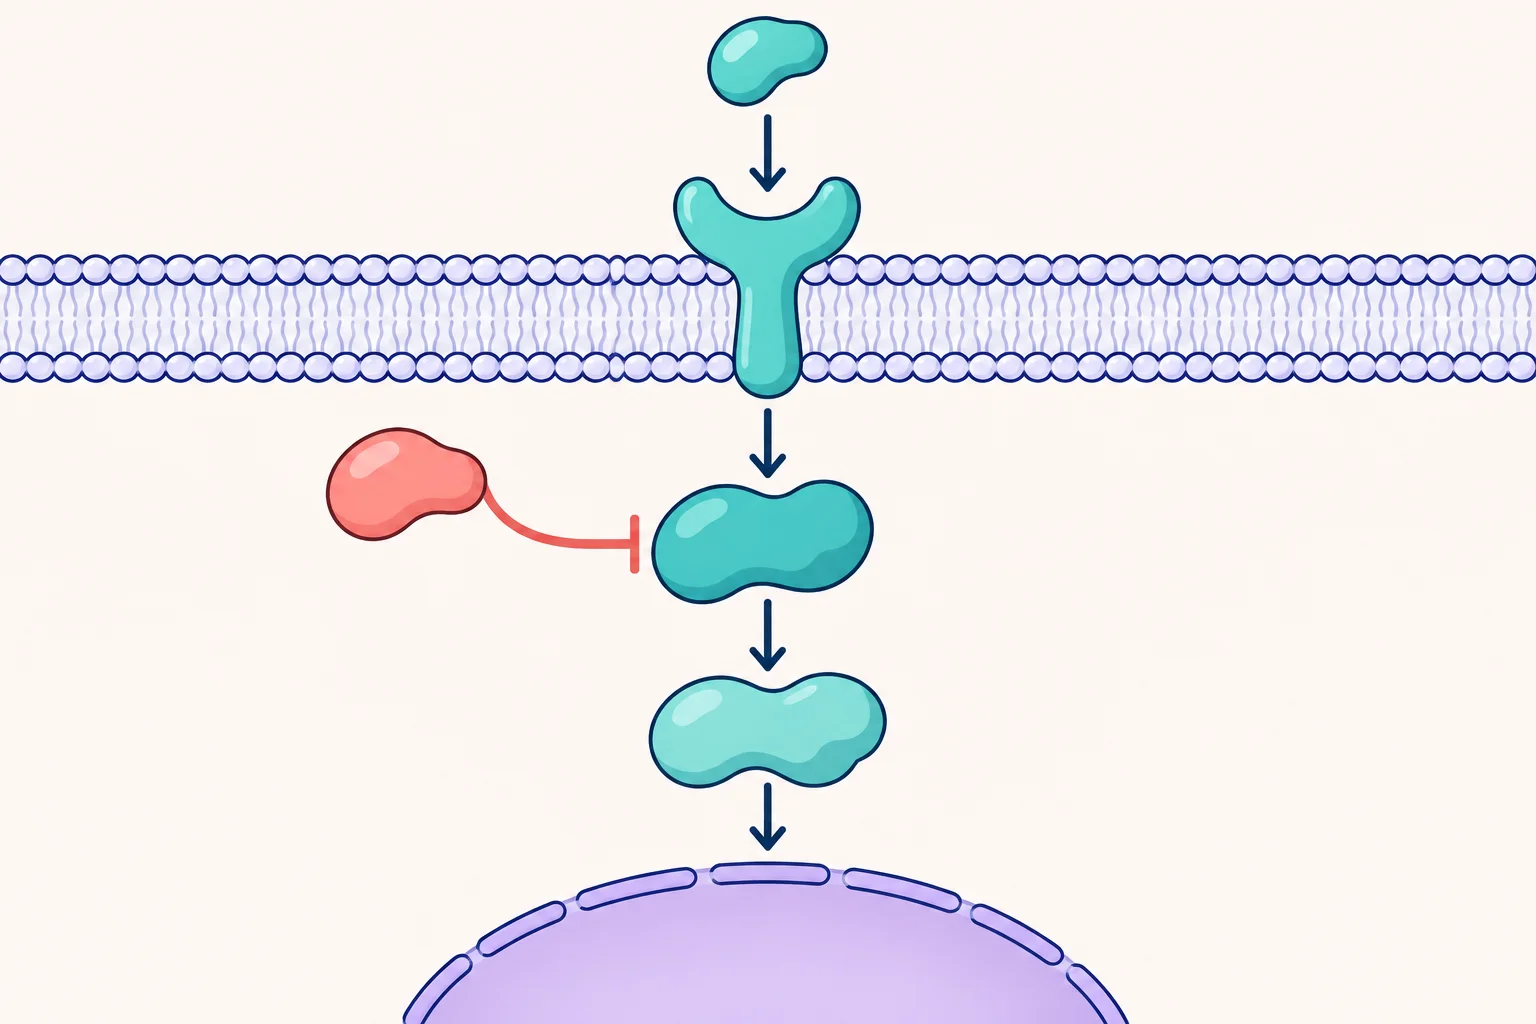
An AI mechanism diagram generator can help organize a pathway or process into a readable figure. The important input is a precise description of the relationships: which component acts on which target, where the interaction happens, and what the evidence supports.
This guide focuses on biological and conceptual mechanism diagrams. Its examples use fictional components called Ligand L, Receptor R, Kinase K, and Factor F. They demonstrate a drawing workflow rather than a real signaling pathway. For chemical reaction mechanisms, use a workflow that lets you explicitly verify bonds, charges, stereochemistry, and electron movement.
Separate the mechanism from the illustration
Before choosing colors or molecular shapes, write the mechanism as a small graph. A node is a component. An edge is a relationship between two components. This simple inventory gives you a way to audit the generated drawing.
Start with a node list:
| Component | Location | Role in this hypothetical model |
|---|---|---|
| Ligand L | Extracellular space | Input signal |
| Receptor R | Cell membrane | Receives the signal |
| Kinase K | Cytoplasm | Relays the signal |
| Factor F | Nucleus | Downstream regulatory component |
| Inhibitor I | Cytoplasm | Inhibits Kinase K |
Then write each relationship separately: L activates R; R activates K; K activates F through an unspecified downstream relay; I inhibits K. This wording deliberately leaves intermediate steps unspecified. A simplified connection should not silently become a claim of direct binding.
Step 1: Define what each connector means
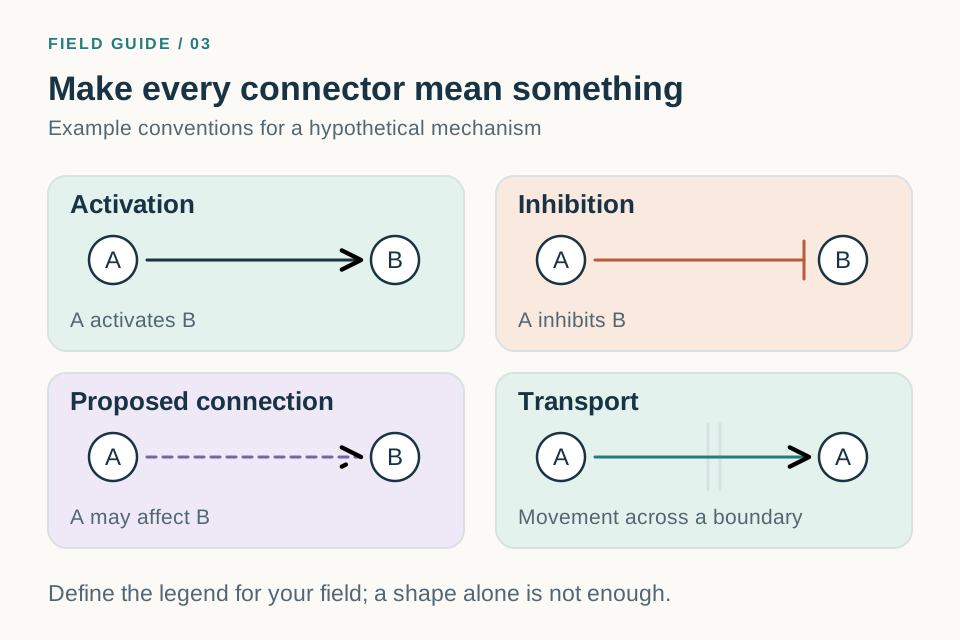
An arrow can represent activation, movement, a process step, or a causal claim. Decide which meaning you need and state it in the legend. Do not rely on the viewer to infer the intended interpretation from the shape alone.
A useful convention for the example in this guide is:
- A solid arrow represents a specified activating relationship.
- A blunt T-bar represents inhibition.
- A dashed arrow represents a proposed relationship, not an established one.
- A labeled connecting arrow can summarize an indirect relay when intermediate steps are omitted.
These are the conventions for this example, not universal rules for every discipline. If your field uses a formal diagram notation, apply that notation consistently and define any departures.
Step 2: Arrange compartments before components
Draw the major boundaries first: extracellular space, membrane, cytoplasm, and nucleus. Put each component in its correct region. This prevents a common failure in automatically composed figures: a clear-looking connection between objects placed in the wrong locations.
Keep the main path easy to follow, either top to bottom or left to right. Place inhibitory branches beside their targets. If many arrows cross, split the mechanism into panels or separate the baseline and perturbed conditions. Avoid using a circular arrangement unless the process is actually cyclic.
Step 3: Give the generator the exact mechanism
Use the generation workspace with an explicit node and relationship list. Here is a prompt you can adapt:
Draw a hypothetical signaling mechanism as a simplified educational schematic. Create four spatial regions: extracellular space above a horizontal cell membrane, cytoplasm below it, and a nucleus in the lower right. Place Ligand L outside the cell, Receptor R in the membrane, Kinase K in the cytoplasm, and Factor F inside the nucleus. Show L activating R, R activating K, and K leading to F through a connection labeled “Indirect relay”. Put Inhibitor I beside K and connect I to K with a blunt inhibition T-bar. Use exactly these five component labels. Use solid arrows for activation, navy outlines, teal pathway components, and coral for the inhibitor. Include a short connector legend. Do not add protein names, feedback loops, extra intermediate steps, or therapeutic outcomes.
The instruction “do not add” is a constraint to check, not a guarantee. Compare the output against the inventory after generation.
For a real mechanism, replace every fictional component and relationship with verified information from your study or references. Keep your source notes outside the artwork so each edge can be traced back to its evidence.
Step 4: Audit connections before visual polish
Review one edge at a time. Read each connection aloud as a sentence: “Inhibitor I inhibits Kinase K.” Then check the source, target, direction, and connector ending. A reversed T-bar can invert the meaning of an otherwise attractive figure.
Next, check omitted steps. Does a single arrow accidentally imply a direct molecular interaction? Does a line crossing the nuclear boundary imply that a protein moves into the nucleus when only a downstream signal is intended? Change the label or structure if the figure invites the wrong reading.
Finally, compare the diagram with its caption. If a relationship is hypothetical in the text, it must not appear experimentally established in the illustration.
Step 5: Revise the smallest meaningful part
Try a focused instruction such as:
Preserve all five components and their compartment locations. Change only the I-to-K connector so it ends in a blunt T-bar at K. Keep the K-to-F connection labeled “Indirect relay”. Add no feedback arrows.
After regeneration, inspect all edges again. If a dense mechanism keeps changing unpredictably, simplify the draft or finish it in an editor with individually editable components. Exact topology matters more than decorative detail.
Common mistakes and how to fix them
| Problem | Why it matters | Useful correction |
|---|---|---|
| Every connection uses the same arrow | Different relations become indistinguishable | Define and apply a connector legend |
| A proposed step looks established | The figure overstates the evidence | Use a defined hypothetical style and matching caption |
| An inhibitor points toward the wrong target | The mechanism changes | Audit source and target for every branch |
| Components cross compartment boundaries | Location or transport is misrepresented | Lock down the spatial inventory |
| Too many crossing lines | The reader loses the main path | Separate branches or create distinct panels |
Frequently asked questions
Can AI infer missing steps in a mechanism?
It may produce plausible-looking additions, but those additions need independent evidence. Supply the steps you intend to show and label any deliberately simplified or unresolved relationships.
How should I distinguish measured and proposed mechanisms?
Define a clear visual convention and explain it in the caption. Keep a separate evidence record for the diagram's relationships so that a reviewer can distinguish a direct observation from an interpretation.
Can I use this workflow for a mechanism of action figure?
Yes, as an illustration workflow. Specify the target, interaction, downstream process, and scope of the evidence. Do not let a molecular schematic imply a clinical benefit that the study did not establish.
Start with the scientific diagram maker, or use the sketch-to-scientific-diagram workflow when you already have the pathway arranged on paper. For general presentation guidance, the Nature Reviews figure design guide discusses clear labels, consistent visual treatment, and avoiding crowded figures.