
Scientific Diagram Maker: A Guide to Clear Research Diagrams
Learn to make scientific diagrams with the right layout, visual hierarchy, labels, and export workflow. Includes a diagram-type guide and practical example prompt.
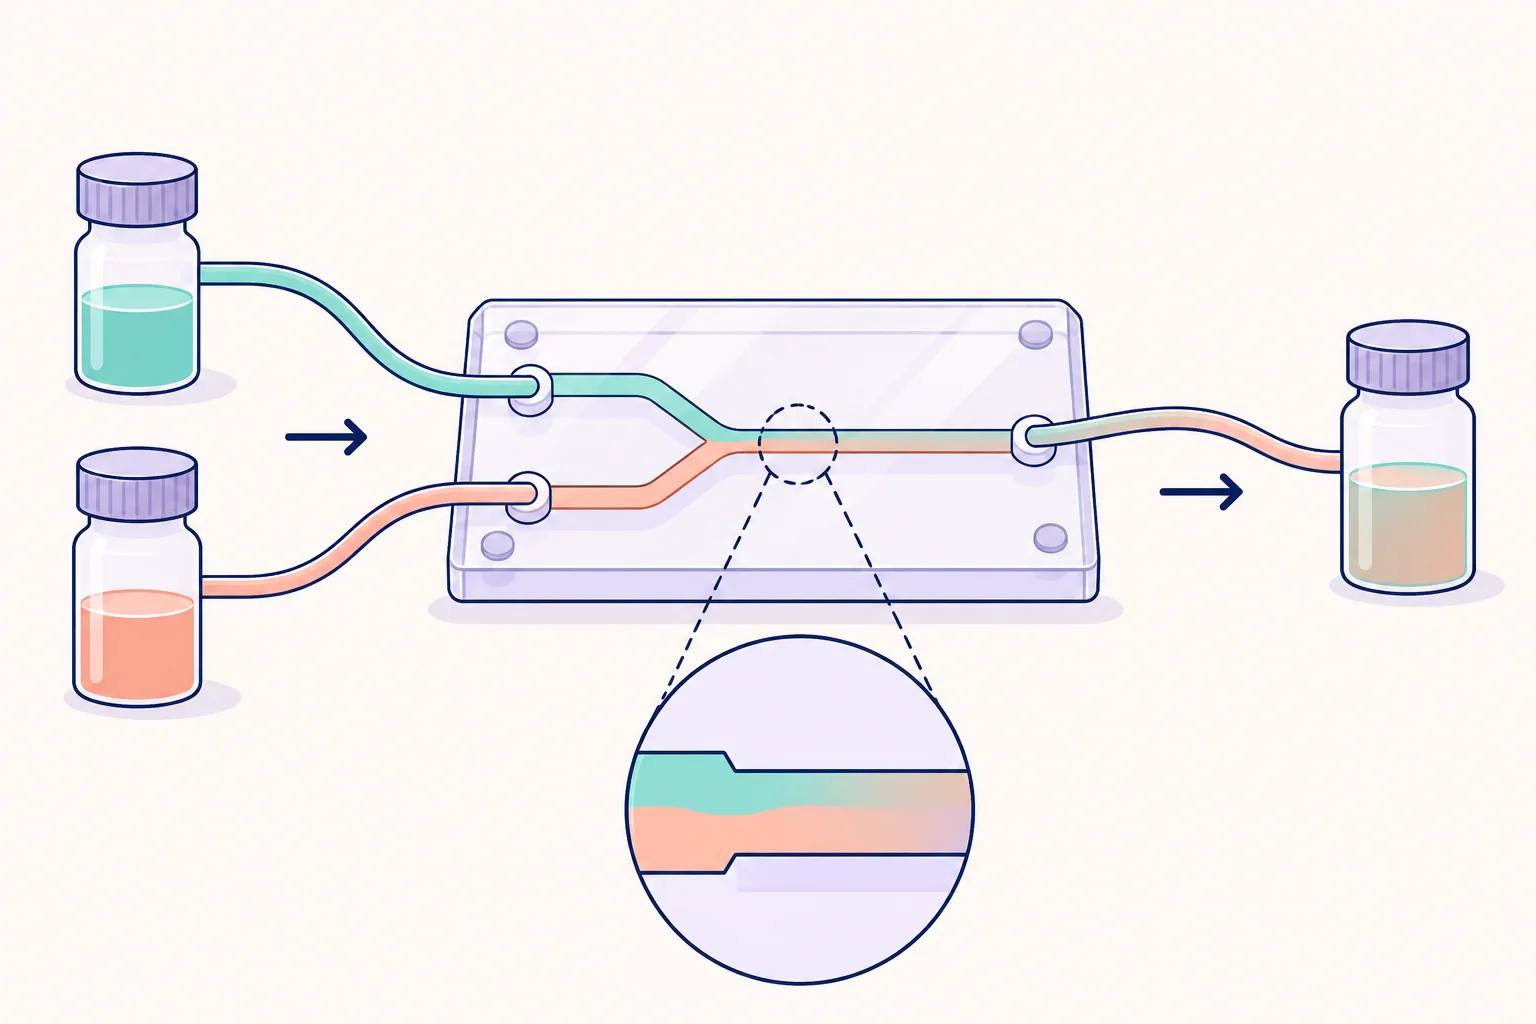
A scientific diagram maker helps you explain structures, relationships, or procedures visually. The right diagram lets a reader answer a specific question: where something is, how a process works, what changes between conditions, or how components connect.
Before drawing, decide which of those questions your figure should answer. That choice determines the layout, the symbols you need, and how much detail belongs on the canvas. The cover illustration is a hypothetical microfluidic setup used to demonstrate scientific visual communication.
Choose the diagram type before the tool
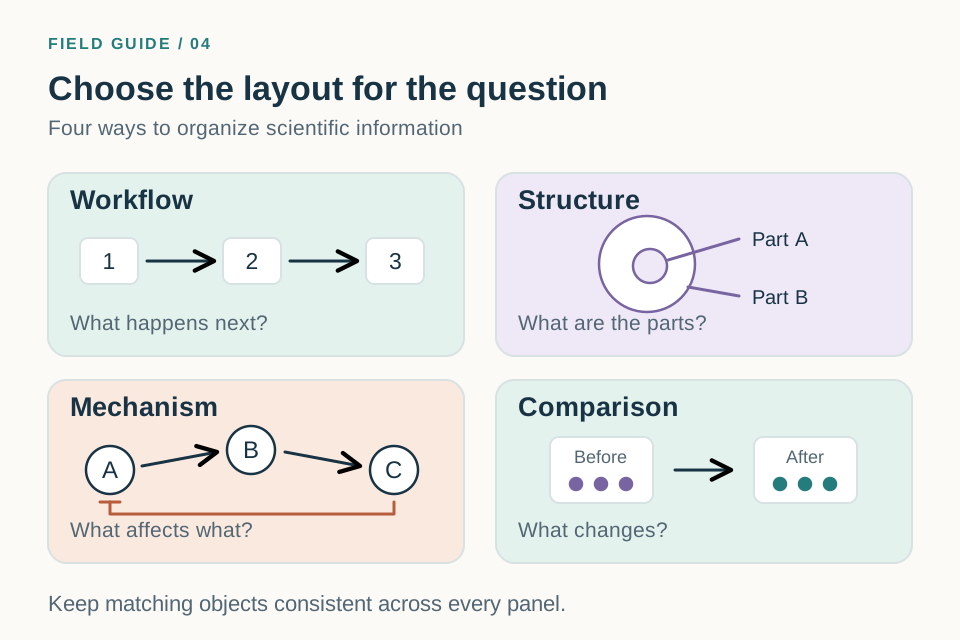
A workflow and a structural diagram may contain the same objects but communicate different information. In a workflow, order is the main message. In a structural diagram, spatial relationships carry the meaning.
| Diagram type | Best question to answer | Typical layout |
|---|---|---|
| Workflow | What happens, and in what order? | A linear sequence or branching process |
| Structure | What are the parts, and where are they? | A cutaway or labeled overview |
| Mechanism | How do components affect each other? | Nodes, compartments, and defined connections |
| Comparison | What changes between two conditions? | Matched side-by-side panels |
If your figure combines types, make the relationship explicit. An apparatus overview can include a small workflow inset, for example, but the inset should not compete with the main drawing.
Step 1: Make an inventory of essential objects
For a hypothetical mixing experiment, the essentials might be two source reservoirs, a chip with two inlets and one outlet, and a collection reservoir. The tubing establishes connections. A magnified channel inset is useful only if channel behavior is part of the explanation.
Classify each element as essential, supporting, or decorative. Draw the essentials first. Add supporting information only when it answers a real reader question. Leave decorative objects out if they make labels smaller or obscure the flow.
Keep a separate label list. This helps you use the same name for an object in the prompt, diagram, caption, and manuscript. “Sample reservoir” and “sample vial” should not become two different components by accident.
Step 2: Pick an appropriate drawing workflow
An AI illustration workflow is useful for drafting a visual composition from text or a sketch. A manual drawing workflow is useful when exact geometry, connector placement, or independent text editing matters. You can combine them: generate a draft, review it, and finish the layout with editable elements.
The scientific diagram maker provides an entry point to the illustration workflow. In the workspace, describe the objects and their relationships, then choose a suitable aspect ratio. Use a reference image if you already know how the objects should be arranged.
For numerical results, generate plots from the underlying data. For molecular structures or engineering drawings, use tools and checks appropriate to those specialized conventions. A general illustration alone does not verify a bond, dimension, or measurement.
Step 3: Establish a visual hierarchy
Make the main objects easy to find first, then the directional connections, then the labels and secondary details. Size, spacing, and line weight can establish this hierarchy without a large palette.
Use color consistently. If teal represents input A, keep it associated with input A across the diagram. Pair colors with labels or shapes so that the meaning does not depend on hue alone. Test the figure in grayscale and at its intended display size.
Nature's initial submission guidance recommends consistent typefaces and colors that remain distinguishable, including avoiding red–green contrast. Treat the journal's requirements as destination-specific guidance, then check the instructions for your own venue.
Step 4: Generate a focused first draft
Here is an example prompt for the mixing setup:
Create a scientific apparatus schematic of a hypothetical two-input microfluidic mixer. Place two source reservoirs on the left, labeled “Input A” and “Input B”. Connect them to separate inlets of a central rectangular chip labeled “Mixing channel”. Show the two channels joining into one outlet connected to a reservoir on the right labeled “Collection”. Use teal for input A and orange for input B, with labels that remain readable without color. Use a white background, dark outlines, and a clear left-to-right flow. Keep the apparatus schematic, not to scale. Do not add pumps, numerical dimensions, flow rates, measurement results, or additional outlets.
The number of inlets and outlets is a critical part of the brief. Review those counts before judging the visual finish. An extra outlet would change the apparatus, even if it makes the drawing look more balanced.
Step 5: Improve labels and spacing
Place a label near its object, with enough separation from neighboring labels to make the association clear. Use leader lines only when proximity is insufficient. Avoid allowing leader lines to cross the flow arrows.
When a figure looks crowded, first remove unnecessary content, then increase spacing. Shrinking all text may make the canvas fit, but it makes the reader's job harder. If several related objects cannot be labeled comfortably, use a numbered key or move secondary explanation into the caption.
A useful revision prompt is: “Keep all reservoir and channel connections unchanged. Increase the vertical space between Input A and Input B. Place each reservoir label beneath its object. Preserve the four exact labels and add no new objects.” Check the connections again after the revision.
Step 6: Export for the actual use case
For a slide, inspect the image in presentation mode. For a paper, place it at the planned column width. For a poster, check both the overall reading order and the labels at normal viewing distance.
Choose a format suited to the required editing and output. A raster file records pixels; a vector file can contain independently editable paths and text. A vector-format wrapper can still contain a flattened image, so verify the file's contents when editability is required.
Save the original source or prompt alongside the final exported file. This makes it easier to change a label later without rebuilding the whole diagram.
Frequently asked questions
What makes a scientific diagram different from a decorative illustration?
Its objects and connections have defined meanings. Placement, arrows, labels, and scale cues should help explain a scientific claim or process. Visual appeal supports that explanation.
How many colors should I use?
Use as many as you need to distinguish meaningful categories, and keep those assignments consistent. Start with a small palette and add a color only when it communicates something the existing colors cannot.
Should a scientific diagram always be to scale?
No. Many explanatory diagrams are schematic. Make that clear when readers could otherwise infer size or distance. Include dimensions or scale bars only when they are justified by the underlying information.
Open the scientific diagram maker to draft a figure from your inventory. For a diagram with many activating or inhibitory relationships, use the more detailed AI mechanism diagram generator guide.