
AI Scientific Figure Generator: A Practical Guide for Researchers
Learn how to use an AI scientific figure generator: write a precise brief, choose a layout, refine labels, verify the science, and prepare your figure for export.
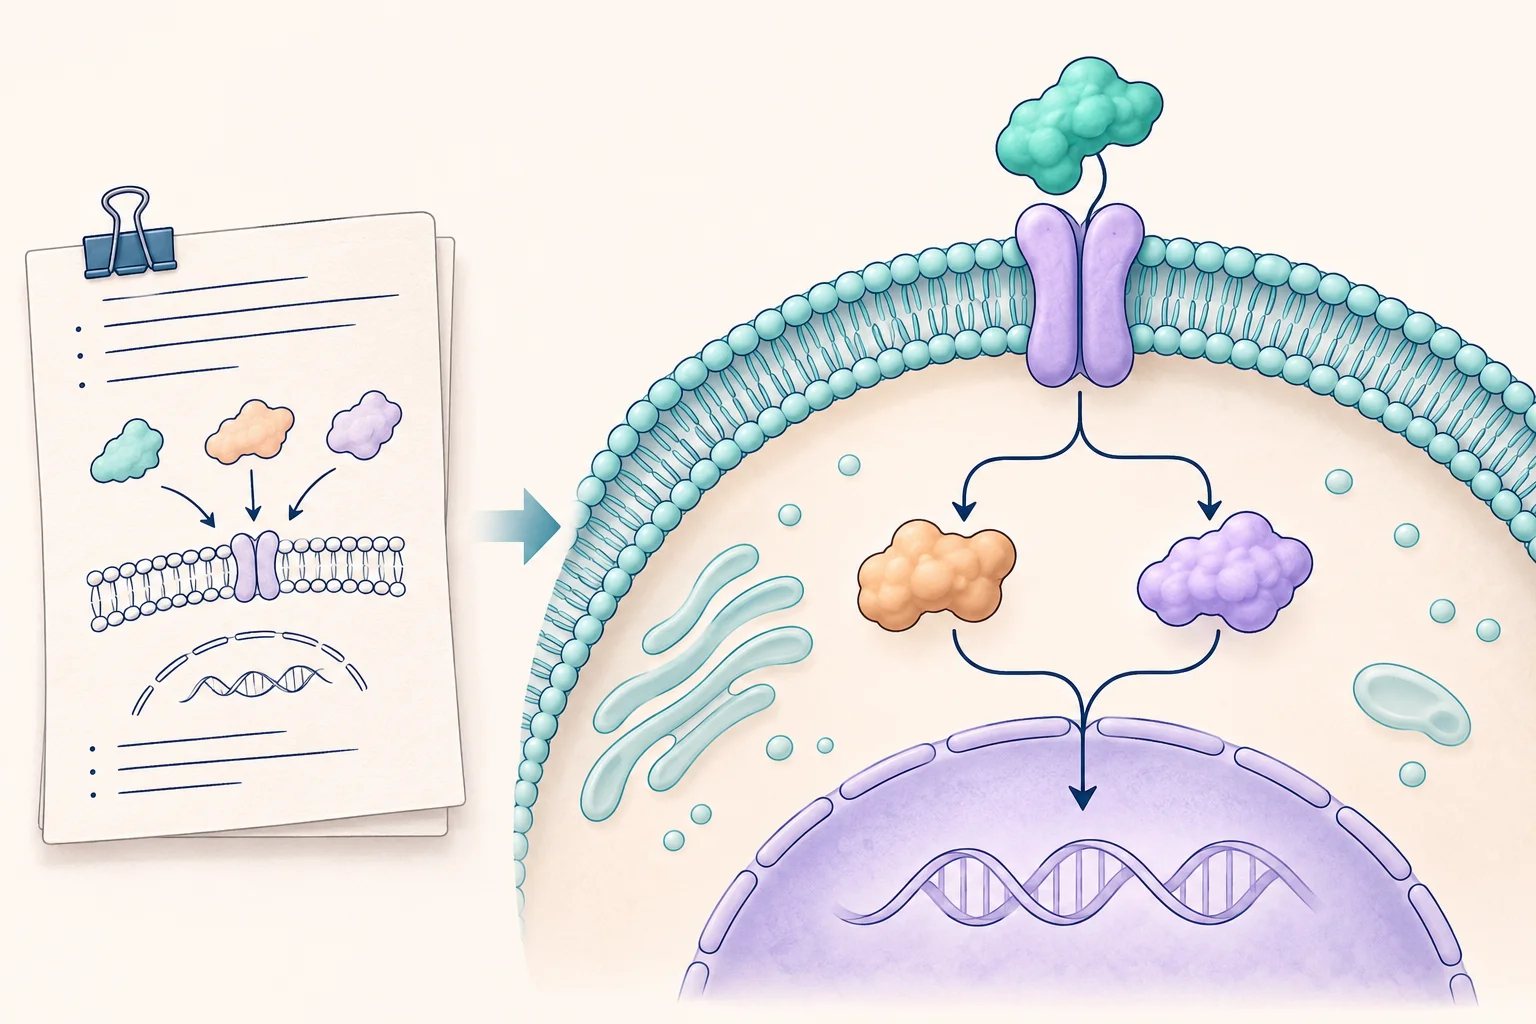
An AI scientific figure generator turns a written description or reference image into a visual draft of a scientific concept. It is useful when you already know what a figure should explain but need help arranging the objects, labels, and connections. The most productive starting point is a short, specific figure brief.
This guide takes you from that brief to a reviewed illustration. It focuses on explanatory figures: experimental workflows, cellular schematics, and concept diagrams. For plots, start with your actual dataset and a reproducible plotting workflow. The cover above is an illustrative concept, not experimental evidence.
Decide what your figure needs to explain
Write one sentence that a reader should understand after seeing the figure. For a hypothetical microfluidic experiment, that might be: “A sample enters a chip, passes through a mixing channel, and is collected for analysis.” This gives the drawing a beginning, a sequence, and an endpoint.
Then choose the figure type that matches the job:
| Your communication goal | Useful figure type | Detail to prioritize |
|---|---|---|
| Explain how an experiment proceeds | Workflow diagram | Step order and inputs |
| Explain how components interact | Mechanism diagram | Direction and type of connection |
| Summarize a paper's main message | Graphical abstract | One takeaway and its context |
| Show where structures are located | Labeled schematic | Boundaries and spatial relationships |
A figure that tries to do all four jobs usually needs too many labels. Separate the tasks into panels or choose the one that matters most to your audience.
Step 1: Build a figure brief
Before opening the figure generator, prepare six pieces of information:
- Purpose: the one sentence the figure must communicate.
- Objects: the exact things that must appear, using your preferred terminology.
- Relationships: what connects to what, and what each connection means.
- Layout: left to right, top to bottom, a comparison, or a cutaway view.
- Labels: the exact wording, capitalization, and symbols to preserve.
- Exclusions: details the model should leave out, such as unmeasured outcomes or additional pathways.
Keep the scientific instructions separate from the visual instructions. “Show the sample moving from the inlet to the collection tube” defines content. “Use thin navy outlines and a white background” defines presentation. Both help, but the first controls the meaning.
Step 2: Use a structured prompt
Here is a complete prompt for a hypothetical apparatus diagram. Replace the example objects with those from your experiment.
Create an explanatory scientific schematic of a microfluidic mixing workflow. Arrange three stages from left to right: a sample tube, a microfluidic chip, and a collection tube. Connect the sample tube to the chip inlet and the chip outlet to the collection tube with directional arrows. Use the exact labels “Sample”, “Mixing chip”, and “Collection”. Keep the chip as a simplified schematic, with no dimensions or scale bar. Use a white background, thin dark outlines, teal for the sample, and a consistent sans-serif label style. Do not add performance values, plots, extra instruments, or claims about the collected material.
The prompt is specific enough to review. You can count its objects, check its two connections, and compare its labels with the output. “Make an impressive scientific figure” gives you none of those checks.
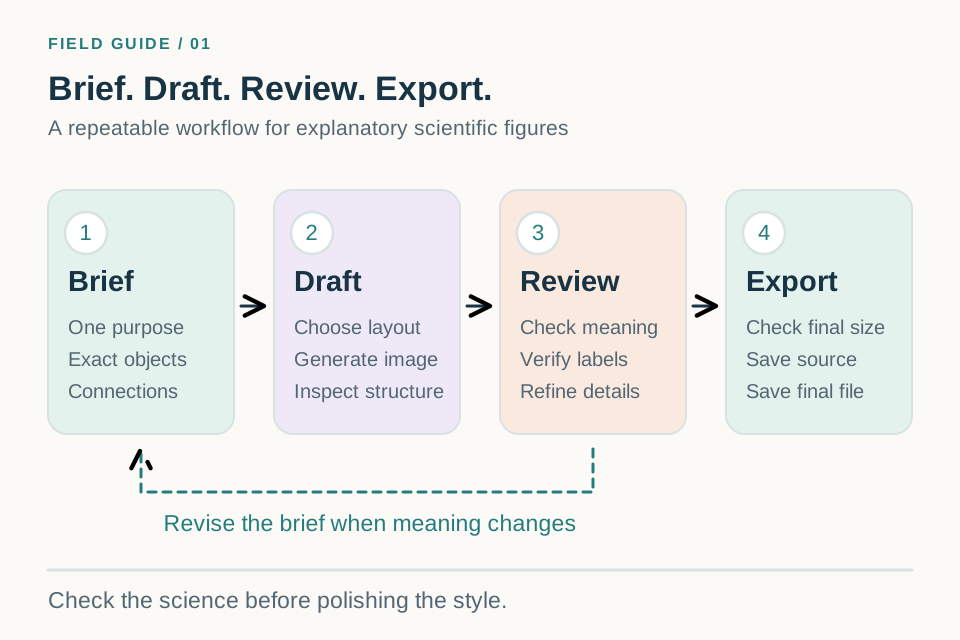
Step 3: Generate a draft and review its structure
Open the workspace, enter the prompt, and choose an aspect ratio suited to the layout. A wide canvas suits a linear workflow; a square canvas can suit a compact cell schematic. Add a reference sketch when the relative positions are important.
Review the first result for content before spending time on colors. Check whether every required object appears once, whether the arrows point in the right direction, and whether labels belong to the correct objects. A polished image can still communicate the wrong sequence.
Step 4: Refine one category of problems at a time
Start with missing objects and incorrect connections. Then correct labels. Finally, adjust spacing, palette, and line weight. This order makes it easier to judge whether a revision improved the figure.
A useful revision request is narrow:
Keep the three-stage layout and all existing labels. Move the “Collection” label below the collection tube. Increase the space between the chip and the collection tube. Preserve the two existing arrows and add no new connections.
You can use a generated image as a reference for a subsequent generation in the workspace. Treat preservation instructions as requests to verify, because a new generation may alter details outside the requested change. Compare the entire figure with the previous version.
Step 5: Prepare the file for its destination
Download the selected image and inspect it at the size at which readers will see it. Keep the prompt, the original output, and the reviewed version together so later revisions have a clear starting point.
Pixel dimensions and print size are connected. For example, an image printed 6 inches wide at 300 pixels per inch needs 1,800 pixels across. That is an arithmetic example, not a universal submission specification. The required resolution depends on the destination and artwork type. Increasing a resolution setting alone does not restore missing detail; Nature's figure preparation guide makes the same distinction.
If a journal requires editable text or vector artwork, plan a finishing step that supplies those elements. Saving a raster image inside a PDF does not make its labels independently editable. Check the target journal's current artwork and AI-use instructions before submission.
A final review checklist
- The figure communicates the intended takeaway without relying on its title.
- Every object, arrow, and compartment matches the source description.
- Names, Greek letters, subscripts, and abbreviations are correct.
- Explanatory illustration is clearly distinguishable from measured data.
- Labels remain readable at the intended display size.
- The saved file meets the destination's format and editing requirements.
Frequently asked questions
Can an AI scientific figure generator create a complete figure from text?
It can create a visual draft from a sufficiently detailed description. Completeness must be checked against your brief; generation does not establish scientific accuracy or suitability for a particular journal.
Should I start from text or a sketch?
Use text when the relationships are simple and the arrangement is flexible. Use a sketch when the panel order, branching, or object placement is already decided. The sketch-to-scientific-diagram guide explains how to prepare that reference.
What should I do if the labels are wrong?
Supply an exact label list and request a focused revision. If exact typography remains difficult, finish the labels in an editor that supports independent text objects, while checking that the underlying image has not changed meaning.
Ready to try the workflow? Open the AI scientific figure generator with one small figure brief. For a paper summary, continue with the graphical abstract generator guide.