
Graphical Abstract Generator: From Paper to Visual Summary
Use a graphical abstract generator to turn a paper into a clear visual story. Follow a storyboard workflow with a sample prompt, layout tips, and review checklist.
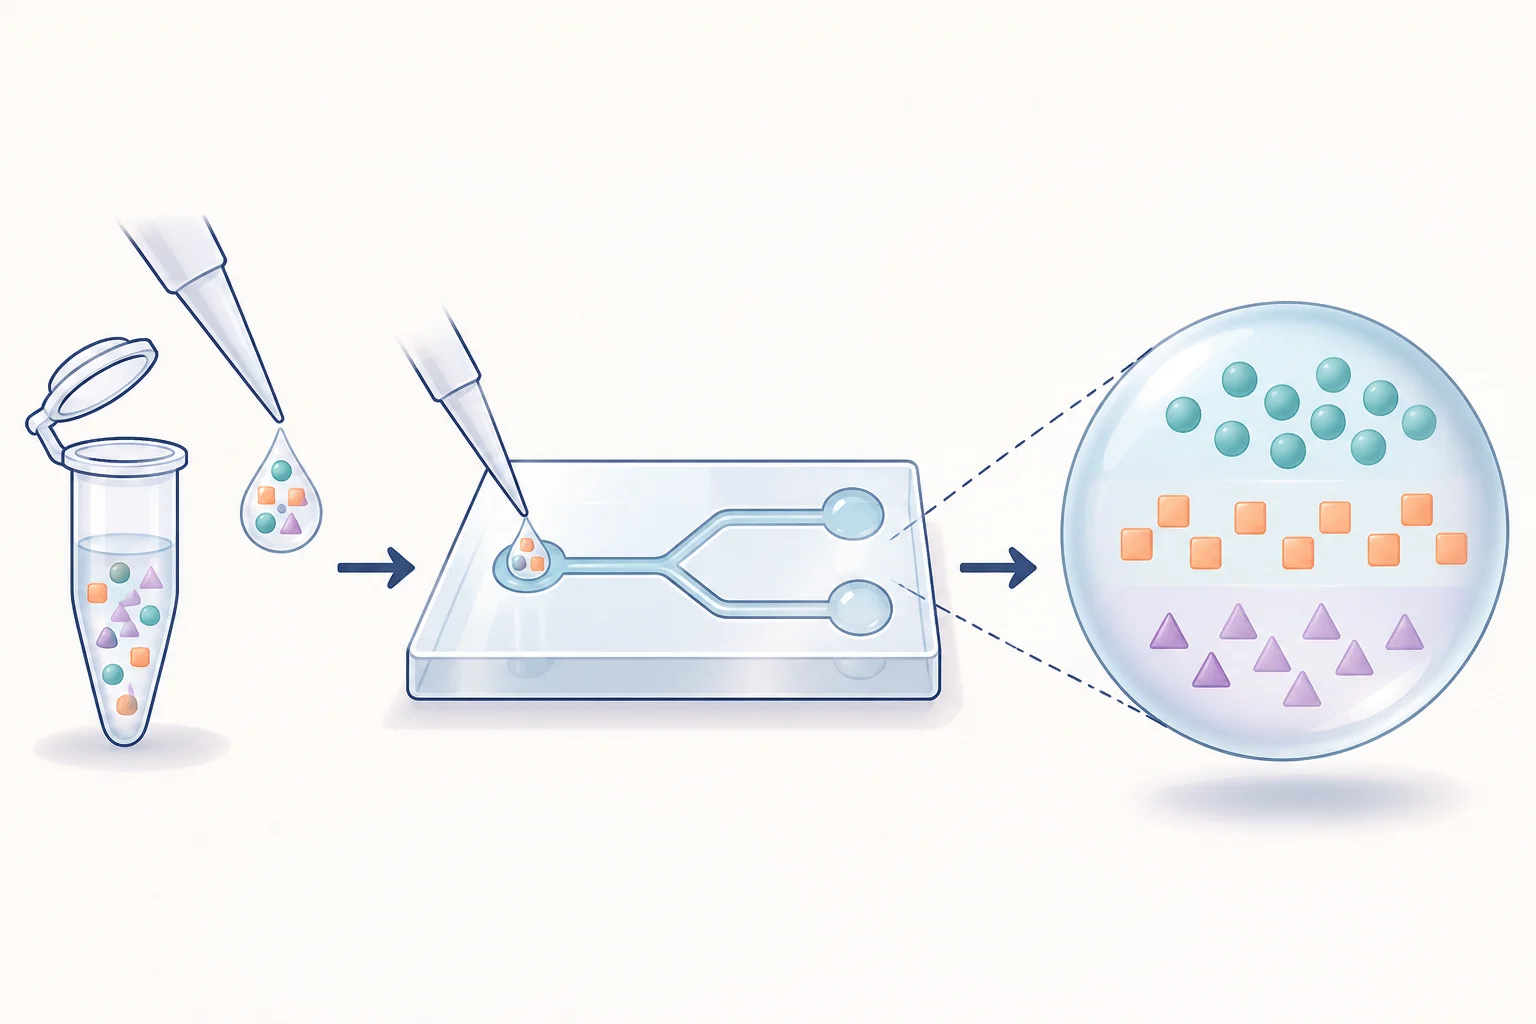
A graphical abstract generator helps turn the central message of a paper into a compact visual summary. The difficult part usually happens before generation: deciding what the picture should say and which details can be omitted. A good graphical abstract gives a reader an entry point into the work without requiring them to decode the whole manuscript.
This guide uses a hypothetical microfluidic separation study to demonstrate the process. The illustrations are teaching examples; they do not report a real experiment or measured performance.
Start with the conclusion you can support
Write a single sentence with three parts: the system, the intervention or method, and the observed finding. Use only information supported by your study. For example: “We tested a microfluidic device that separates a mixed particle sample into two collection streams.”
That sentence establishes a story. It does not claim improved purity, higher recovery, or clinical usefulness. Those would need evidence of their own. Keep the same boundary in the visual: two different collection streams may communicate separation, but a large “100% pure” badge would introduce an unsupported result.
If your paper contains several major findings, choose the one that defines its contribution. Put supporting results in the paper's figures and captioned discussion.
Step 1: Check the journal's brief before choosing a canvas
Record the required aspect ratio, file type, dimensions, text guidance, and any restrictions on AI assistance. These requirements vary. Elsevier's general graphical abstract guidance describes a compact visual summary and recommends a clear reading direction, while directing authors to journal-specific instructions.
The permitted workflow also varies. For example, JCI's graphical abstract instructions permit AI assistance with disclosure. Elsevier's AI policy places specific limits on graphical abstract creation, including a restriction on general-purpose generative image tools. Check how your actual workflow fits the destination's policy; a tool's scientific branding is not an approval from the journal.
For a lab presentation or early storyboard, choose a canvas that fits your narrative, then adapt the composition if its eventual destination changes.
Step 2: Build a three-part storyboard
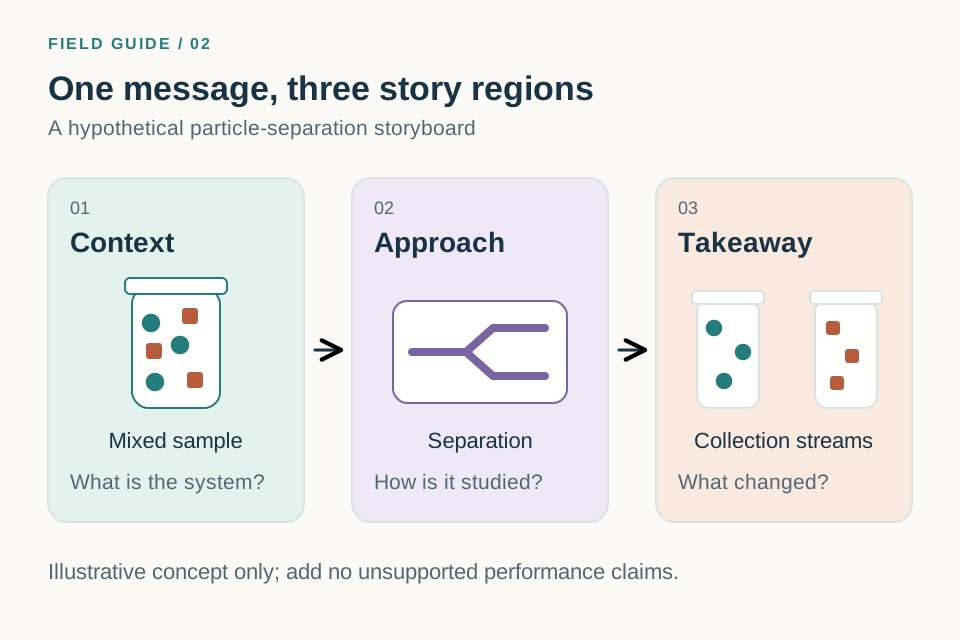
A practical starting structure is context → approach → takeaway. These are story regions, not necessarily separate boxed panels. One continuous scene may feel clearer than three independent illustrations.
| Story region | Question it answers | Hypothetical separation example |
|---|---|---|
| Context | What system or problem are we studying? | A mixed particle sample |
| Approach | What did we do? | Pass the sample through a device |
| Takeaway | What should the reader remember? | Two collection streams |
Give the takeaway enough space to read clearly. A detailed apparatus filling most of the canvas can hide the actual message of the paper.
Step 3: Write the prompt around the storyboard
Open the graphical abstract maker or the generation workspace. Translate the storyboard into concrete instructions instead of pasting the full paper and asking for a summary.
Create a conceptual graphical abstract for a hypothetical microfluidic particle-separation study. Use a continuous left-to-right composition with three clear regions. Left: a sample tube containing teal and orange particles, labeled “Mixed sample”. Center: a simplified microfluidic device, labeled “Separation”. Right: two collection tubes, labeled “Collection streams”. Show the intended flow with two main arrows. Use minimal text, dark readable labels, a white background, and consistent colors for each particle type. Do not add percentages, charts, purity claims, medical outcomes, or extra experimental steps. Keep the apparatus schematic and do not imply a measured scale.
In a real prompt, replace the hypothetical outcome with your verified finding. If the evidence supports enrichment rather than complete separation, show enriched mixtures and say so. Visual simplification should preserve that distinction.
Step 4: Remove details that compete with the story
After the first draft, look at the image as a thumbnail. Can you identify where to start, where to look next, and what the final region means? If not, simplify the composition before adding more explanation.
Remove equipment that is incidental to the main result. Replace long phrases with short labels. Keep a consistent visual identity for an object across the image: a teal particle should not turn orange halfway through the story unless that color change has a defined meaning.
Use one precise revision request at a time:
Keep the sample, device, and two collection tubes. Remove the decorative background objects. Enlarge the collection region and move its label below the tubes. Preserve the particle colors and the direction of flow.
Recheck the content after each revision, including elements you asked the model to preserve.
Step 5: Review the message with someone outside the project
Show the draft to a colleague who understands the field but has not worked on the study. Ask them to describe the message in one sentence before reading your explanation. Their answer can reveal a missing connection or an overly strong visual claim.
If they interpret “tested in a model system” as “works in patients,” change the visual context. If they describe only the apparatus, make the finding more prominent. This quick interpretation check often helps more than another round of decorative polishing.
Before you export
- Does the takeaway match the strength and scope of the evidence?
- Are the main objects and labels understandable at thumbnail size?
- Is there a clear reading direction without crossing arrows?
- Are acronyms necessary and understandable to the intended audience?
- Have you checked the actual journal's dimensions, format, and AI instructions?
- Have you saved the prompt and reviewed artwork for later revision?
Frequently asked questions
Is a graphical abstract the same as a mechanism diagram?
No. A graphical abstract summarizes the paper's message. A mechanism diagram explains relationships or causal steps in more detail. A mechanism can form part of a graphical abstract when it is the main contribution; the mechanism diagram guide covers that more detailed workflow.
How much text should I include?
Start with labels needed to identify the system, method, and takeaway. Remove sentences that repeat what the picture already explains. Follow the target journal's instructions if it specifies a word count or typography.
Can I reuse an existing figure from the paper?
Check the journal's instructions. Even when reuse is permitted, a dense multi-panel results figure may not work as a small visual summary. Recompose the central idea so it can stand on its own.
Build your first storyboard with the graphical abstract maker. For the broader process of prompting, revising, and exporting, see the AI scientific figure generator guide.